It's time for some housekeeping, some pretty Creative Commons photos and some graphs.

This is not my desk. (Photo by Ian Livesey.)
It’s been over a year since I published a Q&A post addressing burning issues in the world of tea drinking. I’d spent the previous month or so thinking about starting a blog and worrying that it was a rather old fashioned, self-indulgent thing to do. But I had a lot of time on my hands (a single typographical error at the Home Office meant my visa application was rejected and my life was completely disrupted - a story for another time) and this was one way of filling it. I looked at a few blogging platforms. I drafted a few posts. I spent a good while wondering what I should call my blog. And finally, I hit publish.
Since then, it’s been a wild ride. By monetising my content and reaching out to key influencers, I’ve grown my brand beyond my wildest dreams. Drilling down into my data, I’ve been able to build a robust picture of my audience and develop strategies to tap those target markets. I’ve engaged in some real blue-sky thinking and I’m now very excited to reveal my compelling plan for this blog moving forward . . .
Since then, it’s been a wild ride. By monetising my content and reaching out to key influencers, I’ve grown my brand beyond my wildest dreams. Drilling down into my data, I’ve been able to build a robust picture of my audience and develop strategies to tap those target markets. I’ve engaged in some real blue-sky thinking and I’m now very excited to reveal my compelling plan for this blog moving forward . . .
This is not my blue sky thinking. (Photo by Yoichi_.)
I jest.
Aims achieved
I began In Which I with the aim of building an online portfolio/archive so potential freelance clients and employers could see that I was indeed capable of (a) stringing a sentence together, (b) writing about different subjects and (c) producing/collating content on a regular basis. I think I’ve succeeded in that. I update once a week on average, have an online record of my monthly walking column for the Battle Observer (I’m a bit behind uploading these, so expect a few more soon) and have published many of the articles I’ve written for the Hastings Independent.
I never expected to join any particular network of bloggers. I thought my subject matter would be too diverse and impersonal to appeal to any niche apart from the good old “people who know me” audience. After all, there aren’t that many people who are really into tea and wild camping and veg*n recipes and walking and local community news from Hastings, East Sussex. But in fact, it turns out the majority of my blog this year has been fairly outdoorsy and there’s a bunch of people who seem to enjoy that. Joining Alastair Humphreys’ Year of Microadventure challenge (wild camping) and coordinating my own themed monthly microadventure challenge (not just wild camping) has also meant that I’ve discovered loads of people who share similar interests. Bonus!
I never expected to join any particular network of bloggers. I thought my subject matter would be too diverse and impersonal to appeal to any niche apart from the good old “people who know me” audience. After all, there aren’t that many people who are really into tea and wild camping and veg*n recipes and walking and local community news from Hastings, East Sussex. But in fact, it turns out the majority of my blog this year has been fairly outdoorsy and there’s a bunch of people who seem to enjoy that. Joining Alastair Humphreys’ Year of Microadventure challenge (wild camping) and coordinating my own themed monthly microadventure challenge (not just wild camping) has also meant that I’ve discovered loads of people who share similar interests. Bonus!
I'm still spying on you
Back in October last year, I kind of implied that I'd give you some updates on the analytics front. Uhhh, better late than never? Sorry!
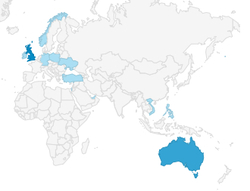
Since I started In Which I, 57% of my visitors (‘new users’ rather than ‘sessions’ for those familiar with Google Analytics) have been from the UK, 13% from the USA and 6% from Australia. I’m surprised there’s more USAn visitors than Australian, given I have a large family/friendship group in Australia. Perhaps this is partly to do with spam referrals - I had to filter a couple of USA locations early in 2015. But while the number of Australian visitors (new users) is quite a bit lower, the number of visits (sessions) from Australia and the USA are fairly similar, demonstrating that my trusty band of Australian friends is much more likely to visit this blog repeatedly.
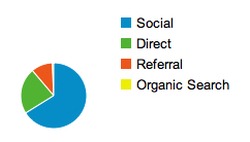
In terms of referrals, 31% of visits (sessions) came via Twitter and 43% via Facebook (this includes m.facebook, lm.facebook and l.facebook traffic, for those playing at home). Other major referrers were this Alastair Humphreys post and Martin Black’s microadventure round-ups.
Since I started In Which I, 57% of my visitors (‘new users’ rather than ‘sessions’ for those familiar with Google Analytics) have been from the UK, 13% from the USA and 6% from Australia. I’m surprised there’s more USAn visitors than Australian, given I have a large family/friendship group in Australia. Perhaps this is partly to do with spam referrals - I had to filter a couple of USA locations early in 2015. But while the number of Australian visitors (new users) is quite a bit lower, the number of visits (sessions) from Australia and the USA are fairly similar, demonstrating that my trusty band of Australian friends is much more likely to visit this blog repeatedly.
In terms of referrals, 31% of visits (sessions) came via Twitter and 43% via Facebook (this includes m.facebook, lm.facebook and l.facebook traffic, for those playing at home). Other major referrers were this Alastair Humphreys post and Martin Black’s microadventure round-ups.
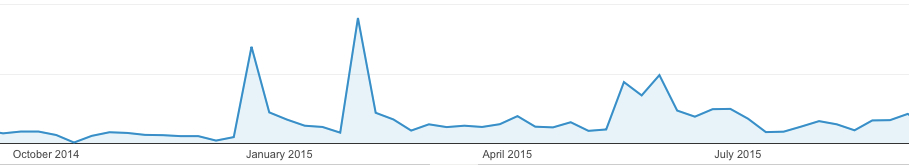
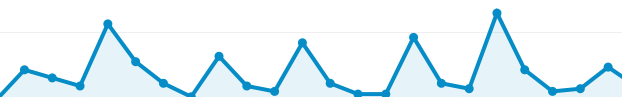
Actually, Alastair Humphreys had quite a big impact on my visitor numbers. The graph above shows my overall traffic for the last year, week by week. Those two big spikes in January and February are a direct result of links from Alastair’s Facebook/Twitter. It’s even more noticeable when you look at the daily traffic.
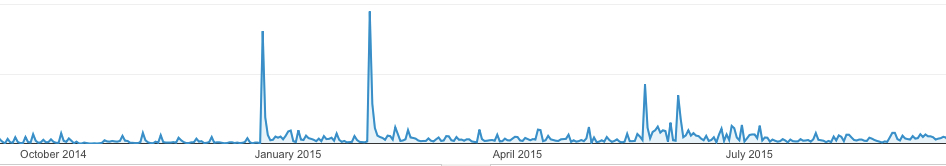
The small increase in traffic around May is the result of a few things: first, a heavy influx of spam traffic; second, the photo-heavy bluebell wood microadventure; and finally, an interview with the former Hastings Children’s Library manager.
Speaking of spam referrals, I currently have something like 36 filters set up and no doubt after I publish this post I’ll get even more faux traffic. So annoying.
Speaking of spam referrals, I currently have something like 36 filters set up and no doubt after I publish this post I’ll get even more faux traffic. So annoying.
What you like
Given those two great stonking referral spikes from Alastair Humphreys, it probably comes as no surprise that the three posts he linked are my three most viewed posts.
- Maps for microadventures - popular because it’s a handy resource.
- Sleeping on a beach on the winter solstice - our first microadventure, popular because it was one of the winter microadventure winners.
- Sleeping in a bluebell wood - probably popular because it's like a storybook.
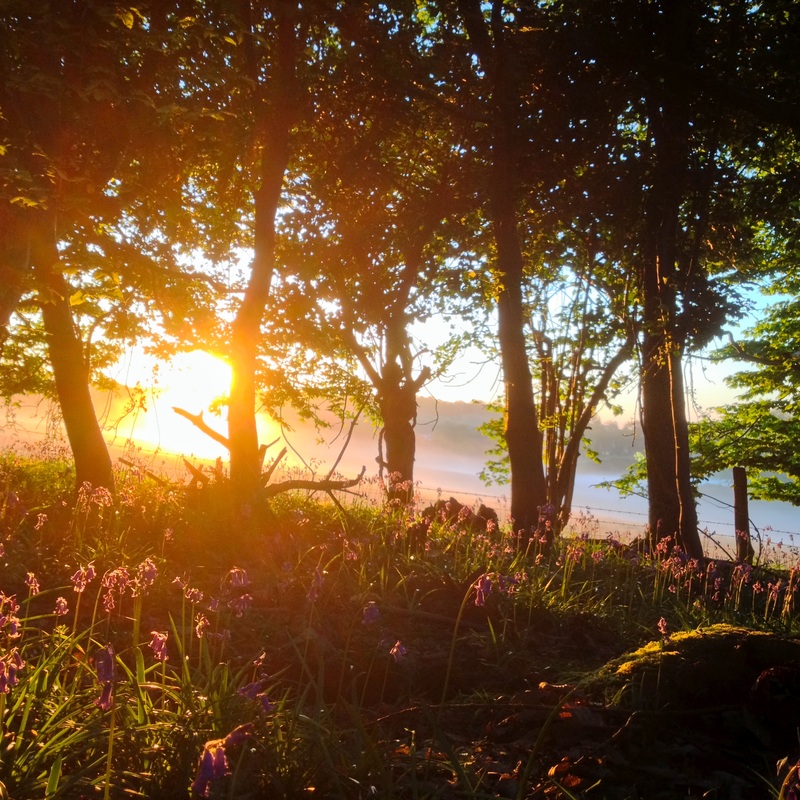
This is my bluebell wood microadventure!
The popularity of the next three comes from different sources.
- Fifteen first lines - a short review of the Start Writing Fiction MOOC, run through FutureLearn and the Open University - popular because I used the #FLfiction hashtags to promote it and (because it was a positive review) it was shared by the course organisers.
- Issuing the microadventure challenge - this is not that popular as a ‘landing page’ but it still has a lot of views, which means that a lot of visitors find the page as a result of internal links (from other posts on my blog).
- How to make hedgerow jam - pleasingly, this has seen a big uptick in organic traffic over the last month because it’s seasonally relevant again and must be ranking well on Google.
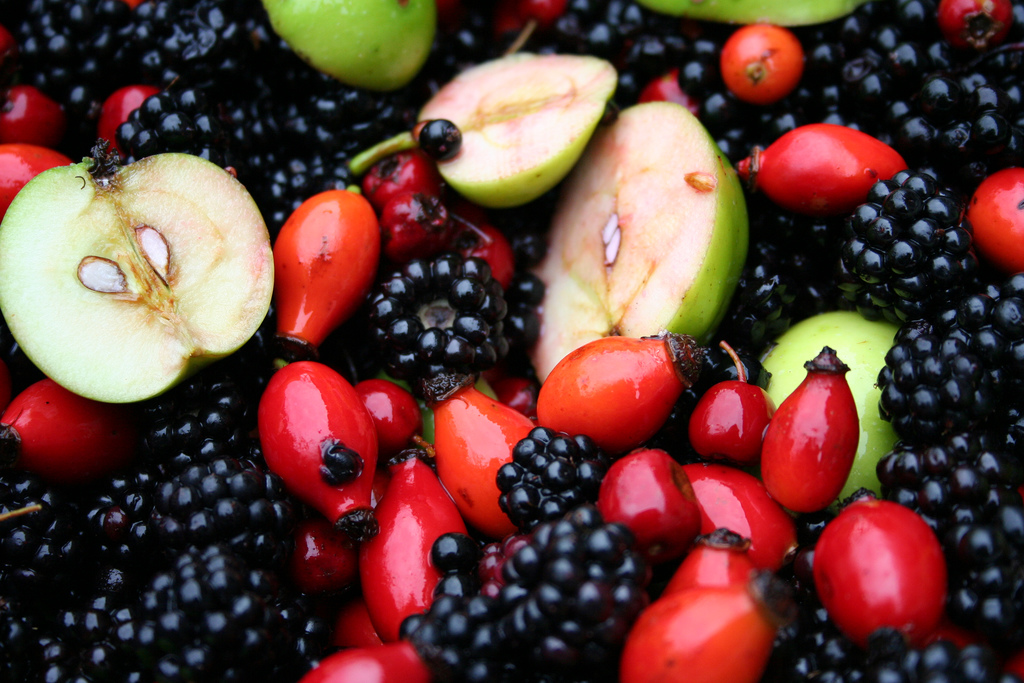
This is not my hedgerow jam - but it's similar. (Photo by cloth kids.)
And here are several more posts that are fairly popular:
- A walk from Hastings Pier to Eastbourne Pier and exploring the River Cuckmere. These are both visited mostly by people around Sussex.
- Walk across Wales (Part 1). It’s interesting that it’s so high up despite being a fairly recent addition to the blog - definitely something people like to read about!
- The first tea post and our Cuckoo Trail microadventure have quite a lot of pageviews. Neither of them feature in the top 15 landing pages, so people must be clicking through from other posts on this site.
- My Big Pathwatch article. The opposite is true of this one, as it’s one of my top 10 landing pages, but it isn’t that high in overall visits.
- Adventures in moth trapping. I’m really just adding this as an honourable mention because I loved doing it so much! Look at those moths!
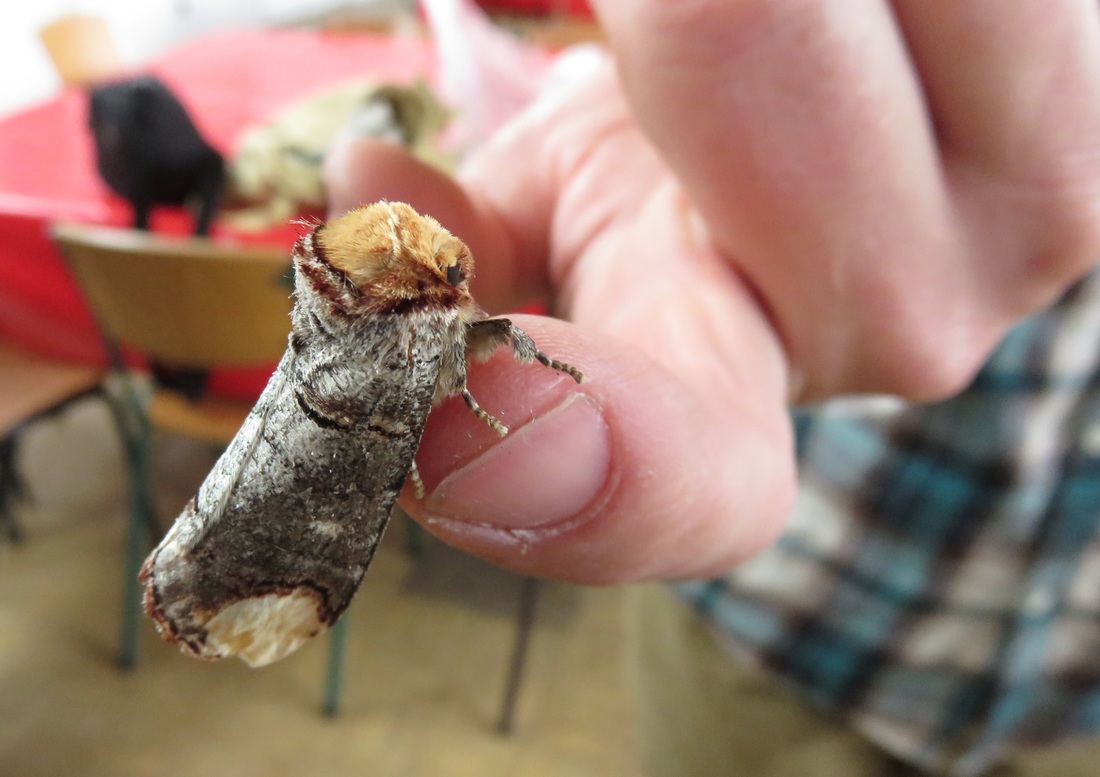
This is not my buff-tip moth, but it is my photo of a moth.
What's in store
Now that I’m officially allowed to stay in the country (phew) - and now that summer is over - I’m beginning to look for a job. I’m planning to take a couple of months off from my walking column at the Battle Observer, so there might not be a November or December walk article. At the end of 2015, I will also finish the two year of microadventure challenges. But I’m not planning to stop blogging. I’m just hoping to take a step back and think about what I might want to do and write about next year.
So, is there something I’ve touched on before that you’d like me to revisit? Something you are especially interested in reading about? A new hobby you think I should take up (lacemaking, campanology, kitesurfing)? An old hobby you think I should knuckle down and do something with (music, creative writing, filmmaking, media criticism)? I can’t promise I’ll get around to it, but I promise I will consider your suggestions. Even the outlandish ones.
There is one other change afoot. Up until now, all of my post titles have been an extension of the blog name, so they can all be read as “In which I [x]” (e.g. In which I sleep in a ruin in Suffolk, In which I make room for nature with #30DaysWild, In which I forage for and cook with Alexanders). Did you notice? While it’s kind of fun, I’m growing tired of the formula. So, I hereby give myself permission to mix it up a bit, starting with this post.

These are not my paintbrushes. (Photo by TonalLuminosity.)
Finally, I'd like to say a big thank you to everyone who has commented on my posts, taken part in the microadventure challenges, linked here from their site and/or connected with me on social media over the last year. It's meant a lot and I've enjoyed it.
 RSS Feed
